Transform your data into simple and intuitive graphical representations.
Understand what you see better, to make better decisions.
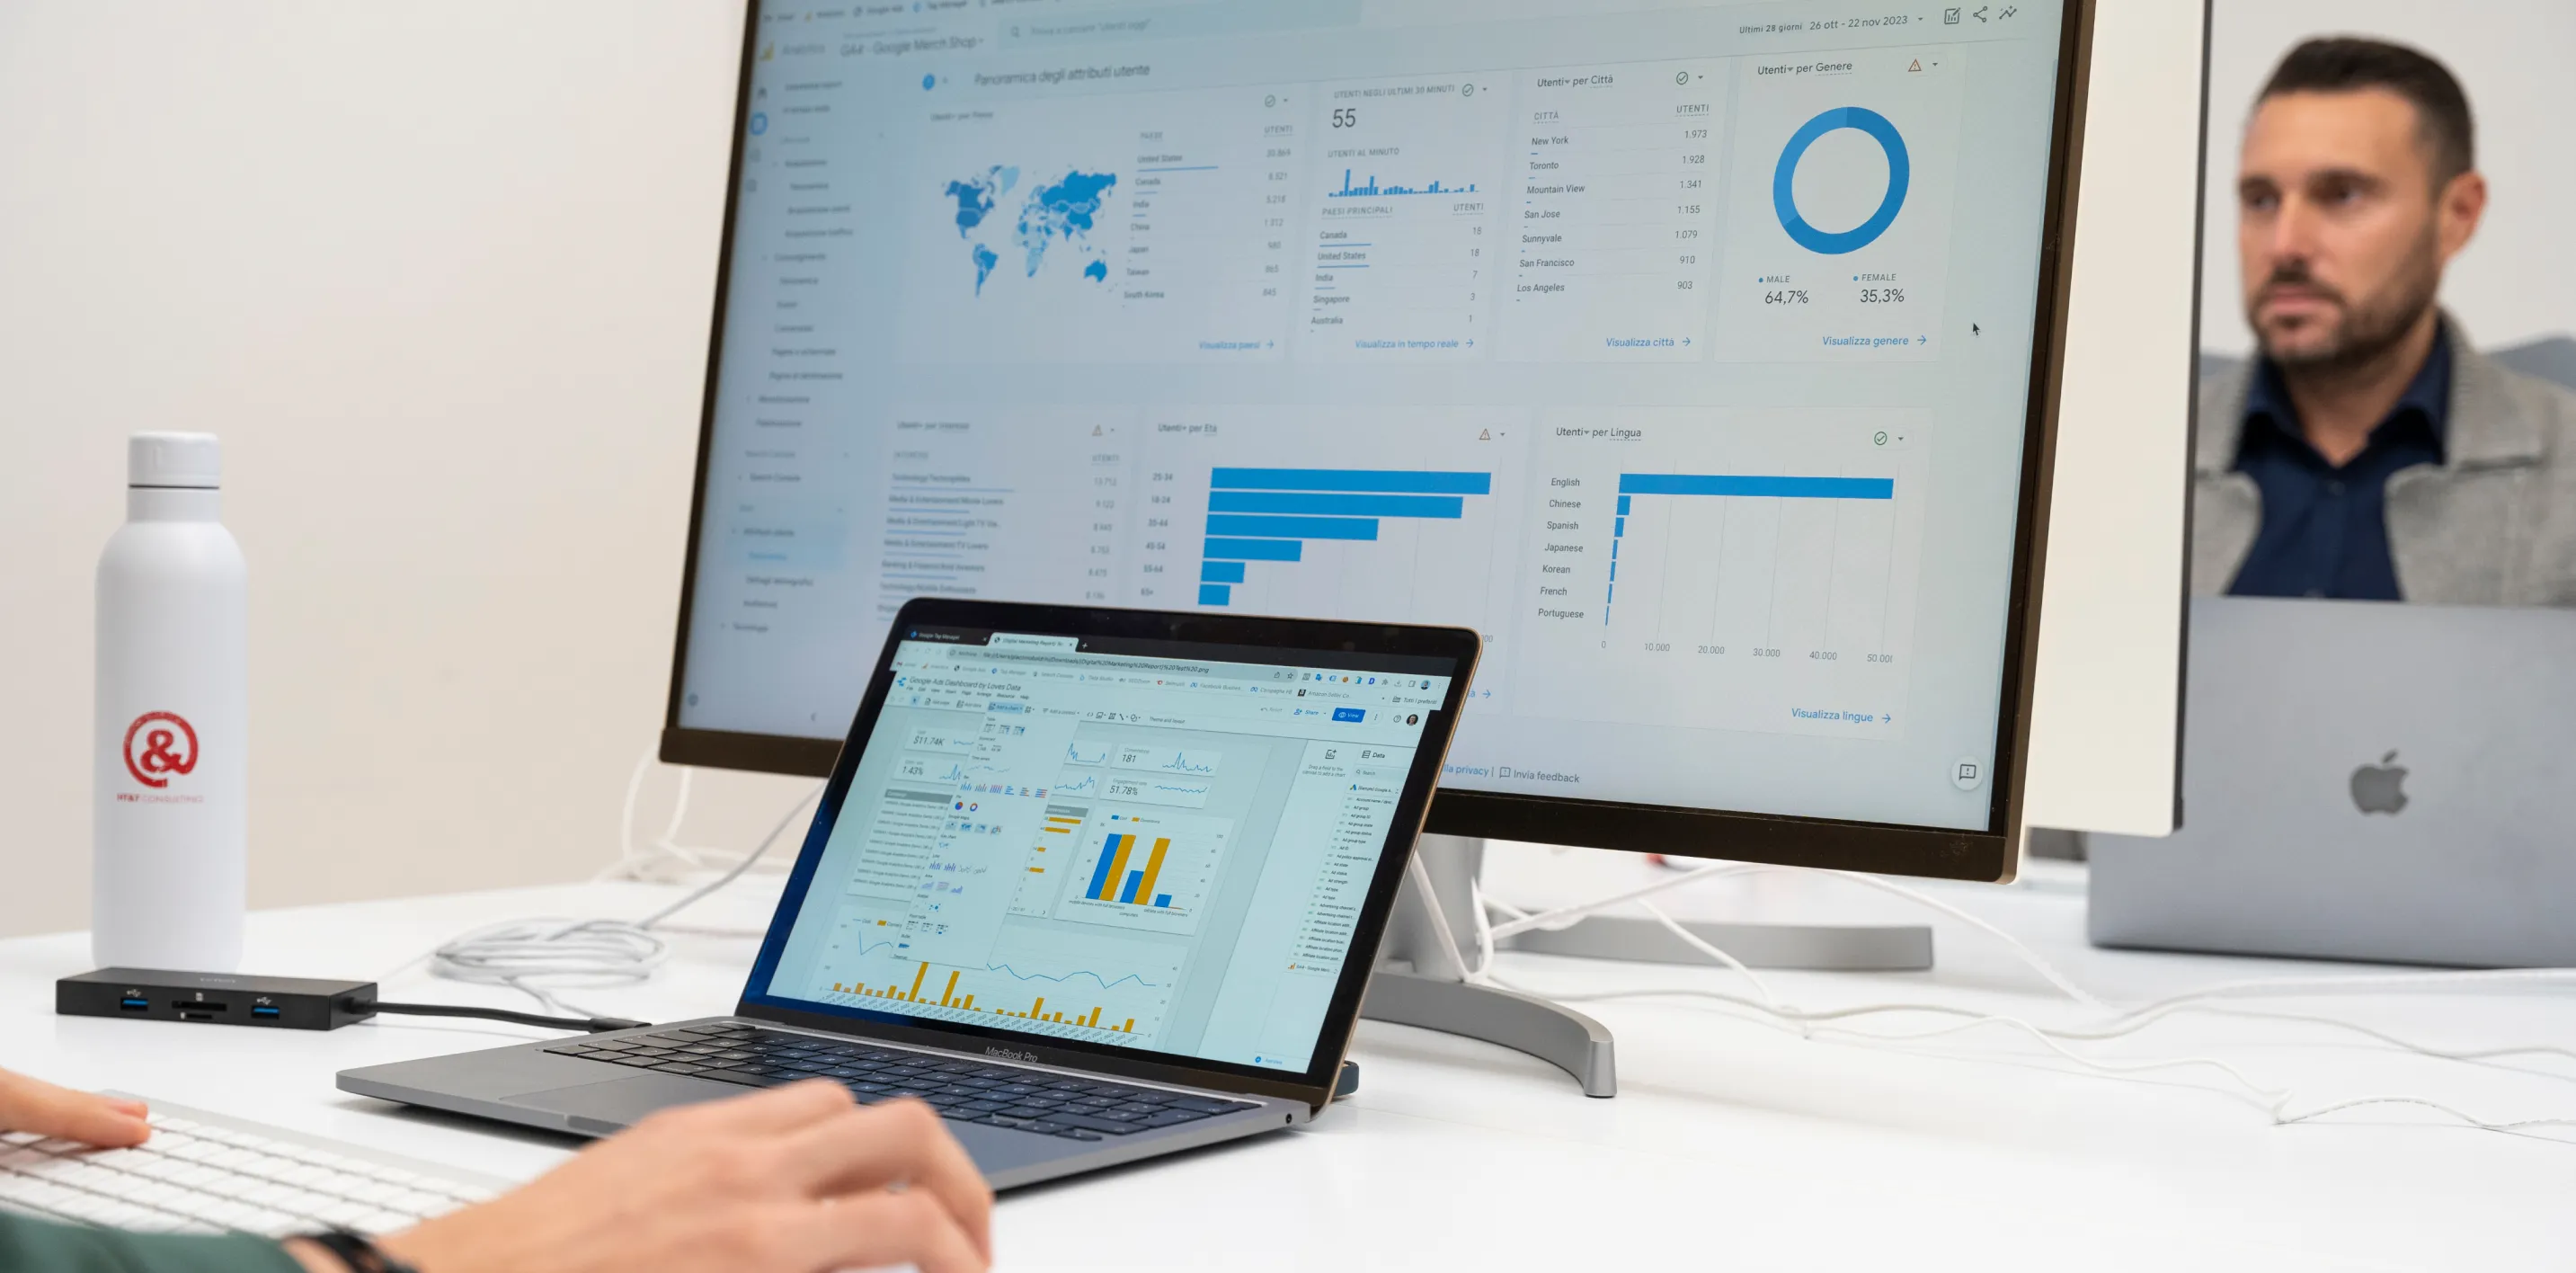
Data Visualization allows you to create a visual and more intuitive representation of data, through visual elements such as: tables, diagrams, graphs and maps, thus allowing a better reading of your information.
Find out how
What is Data Visualization?
Data accessible to everyone.
Data Visualization, or data visualization, is a process of graphically representing data, making it easier to understand the collected information.
Based on the psychology of visual perception, it allows for faster and more intuitive reading of the report.
Through the creation of dashboards, all the necessary metrics for your business are collected. With just a quick glance, it will be possible to analyze the performance of your activity, highlight trends and areas for improvement, so that you can evaluate a digital strategy in real time.
- Main advantages:
Identify areas of business where changes or improvements are needed. - Gain a better understanding of key factors in your business.
- Combine qualitative and quantitative data from different advertising channels.
- Compare data trends over time.
- Identify trends in order to make predictive analyses.
Method
We’ll handle it!

We show you the complete picture
HT&T Consulting’s mission is to guide its clients towards the optimization of their business through the Data Visualization service. We offer comprehensive services to lead companies to digital success, structured into 3 macro-activities:
Creation of dedicated dashboards
We will take care of building specific dashboards for your business. They will be created to give visibility to the project KPIs, so as to have the few, but fundamental, reference numbers. The dashboard will also be structured according to the customer’s instructions, so as to facilitate reading and understanding
Dashboard analytics
We will analyze the data from the reports created together. In this way, the complete picture will be clear and we will be able to extrapolate the derived evidence.
Periodic sending of the dashboard
In addition to analyzing the various reports with the HT&T Consulting team, the dashboard will be scheduled over a sending period, so as to have a complete picture of the performance of your business every week/month/quarter.

They may also interest you:

The new frontier of green hospitality.
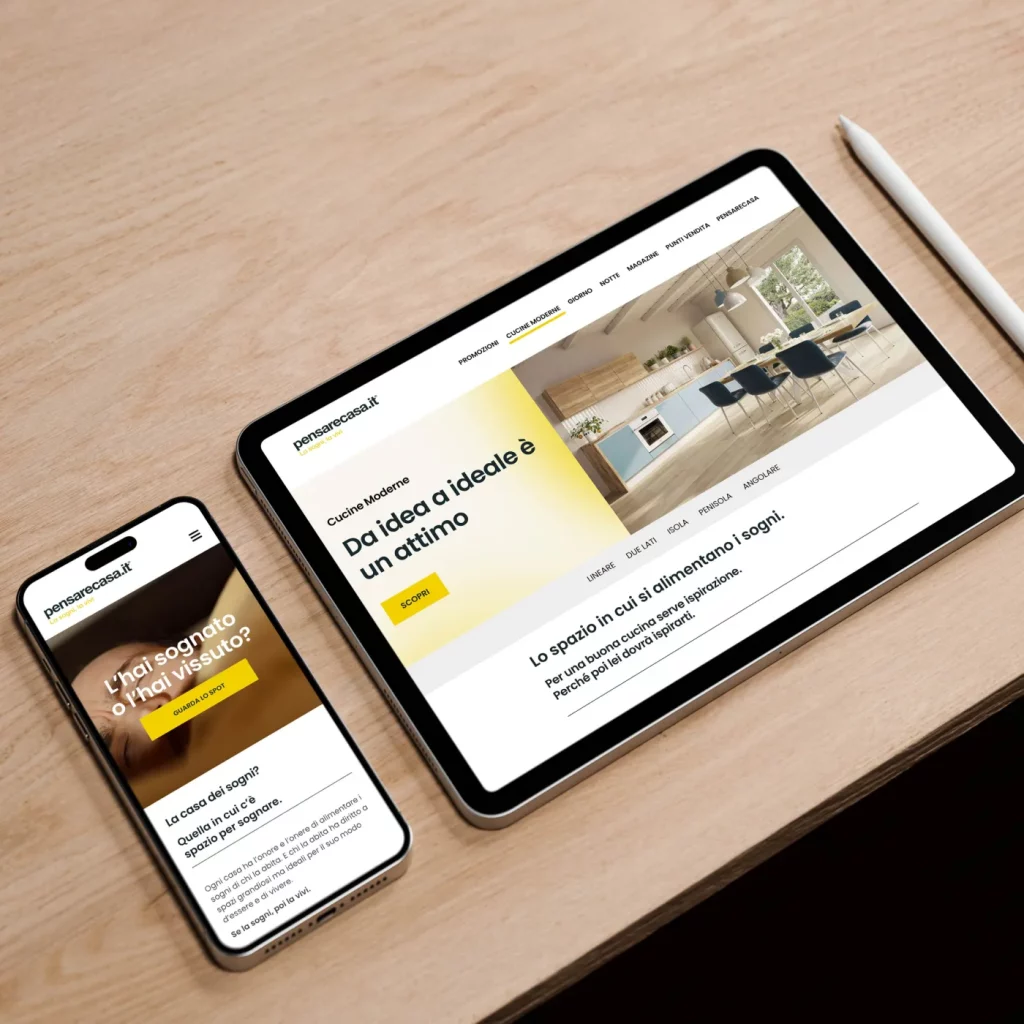
Pensarecasa.it: when furniture meets people.
