
Web Analytics & Data Visualization
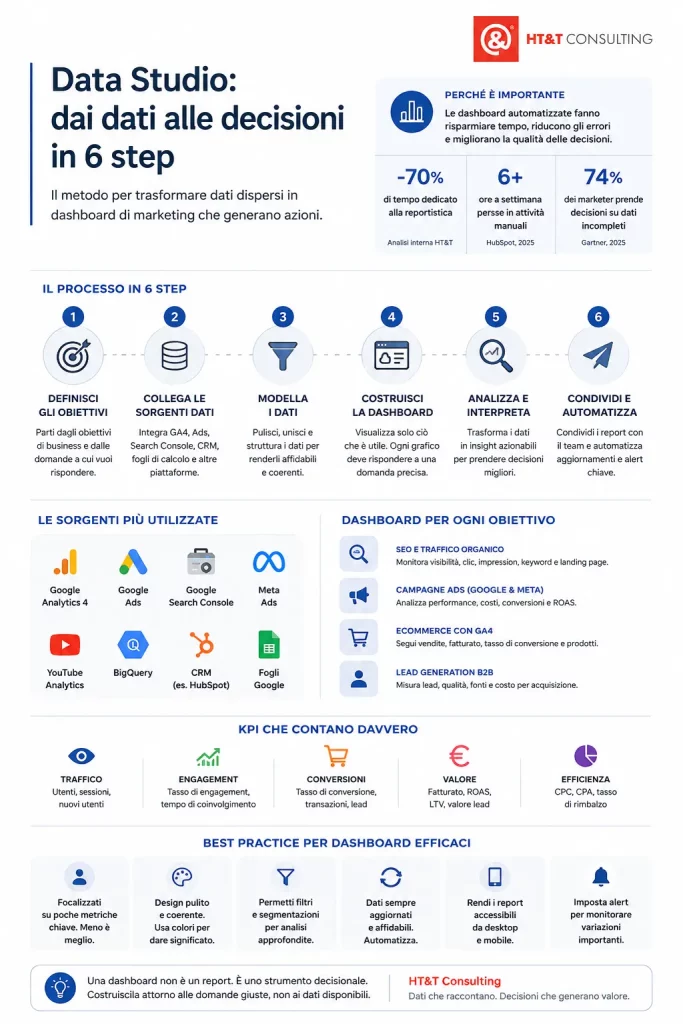
Data Studio (formerly Looker Studio): how to build marketing dashboards that support decision-making
In April 2026 Google renamed Looker Studio back to Data Studio, returning to the original name after three years of confusion. But beyond the name, the platform has become much more powerful.
This is the practical guide to using it properly, written by people who use it every day.
This guide comes directly from HT&T Consulting’s experience, a Google Marketing Platform certified agency and one of the few Italian partners listed in Google’s official partner portal.

In short
Data Studio (previously Looker Studio, and before that Google Data Studio) is Google’s free platform for building marketing dashboards and reports connected to GA4, Google Ads, Search Console, Meta Ads, spreadsheets and more than 800 data sources.
A well-designed dashboard answers one single question: what should I do now? It is not a collection of charts but a decision-making system. This guide explains how to build it starting from business goals rather than tools.
Data Studio and marketing reporting: the numbers
Data Studio: the return of the original name
Before diving into the practical guide, it is worth clarifying the naming situation because it creates confusion and will continue to do so for months.
On April 10, 2026 Google announced the return to the name Data Studio, abandoning Looker Studio after three and a half years. The rebrand officially became effective on April 16, 2026. The paid version is now called Data Studio Pro (formerly Looker Studio Pro).
The official reason is the need to clearly separate two products designed for different audiences: Data Studio for self-service reporting (marketing teams, analysts, SMEs) and Looker for enterprise Business Intelligence (data engineers and large organizations).
Sharing the same “Looker” name created confusion about which platform was intended for whom.
In this article we use Data Studio as the primary name, while still referencing Looker Studio where necessary for clarity, because most online content still uses the previous name and both terms will remain in circulation for a long time.
Why most dashboards fail
The average marketing dashboard is an accumulation of charts.
There is the sessions chart, the conversions chart, bounce rate, Google Ads impressions, social media followers — all on one page, all updated in real time. And nobody knows what to do with it.
The problem is not the tool but the approach.
A dashboard built around available data instead of business questions inevitably produces the same outcome: lots of numbers, very few answers.
The right questions depend on the role of the person reading the report.
A CEO wants to know whether the business is growing and where budget is being wasted.
A marketing manager wants to know which channels generate qualified leads.
A paid specialist wants to know which campaign delivers the highest ROAS.
These are three different dashboards — or at least three different pages within the same dashboard.
The perfect dashboard does not exist — only the right dashboard for the person making decisions.
A report that works for a paid specialist is incomprehensible for a CEO, and vice versa.
The first mistake is building a dashboard for everyone.
This principle is the same one behind our approach to business data visualization: simplifying data to accelerate decisions, not adding visual complexity.
Connectors and data sources: what should you connect?
Data Studio connects to more than 800 data sources through native and third-party connectors.
Native Google connectors are free and can be configured in just a few clicks.
Third-party connectors (such as Supermetrics for Meta Ads, TikTok and LinkedIn) often require an additional license.
Most useful connectors for marketing
| Source | Connector | What it provides | Cost |
|---|---|---|---|
| GA4 | Native Google connector | Sessions, conversions, ecommerce, events, audiences | Free |
| Google Ads | Native Google connector | Clicks, impressions, costs, conversions, campaign ROAS | Free |
| Search Console | Native Google connector | Clicks, impressions, CTR, average position by query and page | Free |
| Google Sheets | Native Google connector | Manual data, targets, budgets, exported CRM data | Free |
| BigQuery | Native Google connector | Warehouse data, custom SQL queries, historical datasets | Free (BigQuery costs separate) |
| Meta Ads | Supermetrics / third-party | Facebook and Instagram campaigns, CPL, ROAS, reach | Paid |
| LinkedIn Ads | Supermetrics / third-party | B2B campaigns, lead form performance, cost per lead | Paid |
| HubSpot / Salesforce | Certified connectors | CRM pipeline, won/lost deals, lead quality, revenue | Paid |
For teams using Supermetrics to aggregate multi-channel data inside Data Studio,
we published a detailed guide on how to automate data flows with n8n and Supermetrics, reducing manual collection and normalization work even further.
SEO and organic dashboards: the metrics that matter
An effective SEO dashboard in Data Studio answers three fundamental questions:
- Is organic traffic growing?
- Which pages and queries generate traffic?
- Where are the opportunities we can act on immediately?
Core metrics to include
- Total clicks and impressions from Search Console, with weekly trend and previous-period comparison
- Average CTR — a low CTR with high rankings usually signals a title or meta description problem
- Average ranking position by page, useful to identify high-volume pages ranking between positions 4 and 10 (quick wins)
- Top 10 queries by impressions, with CTR analysis to identify untapped visibility
- Top organic landing pages from GA4, including conversion rate analysis
- Channel trend comparison, organic vs direct vs referral
Google Ads and Meta Ads campaign dashboards
Advertising dashboards are the most likely to become overloaded with metrics.
ROAS, CPA, CPL, CTR, impressions, frequency, quality score — everything looks important.
The real rule is selecting the metrics that change decisions, not the ones that simply confirm what you already know.
Recommended structure for an advertising dashboard
Budget and performance overview
- Total spend vs planned budget, with alerts when thresholds are exceeded
- Overall and channel-level ROAS compared against targets
- Total conversions and cost per conversion on weekly trends
Campaign performance
- Campaigns sorted by spend, ROAS, conversions and CPA
- Underperforming campaigns highlighted for immediate action
- Learning-phase campaigns separated to avoid premature optimization
Traffic quality
- Campaign CTR to identify targeting or creative issues
- Meta Ads frequency monitoring to detect audience saturation
- Post-click conversion rate comparison across channels
This structure directly connects to the optimization logic we describe in our guides to Google Ads for ecommerce and Meta Ads B2B: the dashboard is the operational layer that makes those strategies actionable.
An advertising dashboard that does not display campaign-level ROAS and target comparison is useless.
One that shows it with a visual traffic-light system — green above target and red below — saves 20 minutes of analysis every review cycle.
GA4 ecommerce dashboards
For ecommerce businesses, the most important Data Studio dashboard is the one that visualizes the complete purchase funnel, from impression to transaction, including conversion rates for every step and revenue by channel and product category.
Recommended GA4 funnel
- 01
view_itemproduct view - 02
add_to_cartcart addition - 03
begin_checkoutcheckout started - 04
purchasecompleted purchase
Purchase funnel
Visualize the view_item → add_to_cart → begin_checkout → purchase journey with the transition rate between every step.
This helps identify exactly where the largest number of users is lost.
- Segmentation: device, acquisition channel, product category
- Alert: drop in the begin_checkout → purchase rate below the historical threshold
Revenue by channel and product
Displays revenue generated by acquisition channel and product category, compared against the previous period.
This is the report that answers the question:
“where does our digital revenue come from?”.
Data-driven attribution
Uses GA4’s data-driven attribution model to show the actual contribution of each channel to conversions, moving beyond last-click logic.
Avoid ecommerce dashboards based only on last-click attribution:
they systematically underestimate upper-funnel channels such as organic, display and social.
B2B lead generation dashboards
In B2B, the most critical dashboard is not the traffic dashboard but the one connecting leads generated by digital channels to opportunities inside the CRM.
Without this connection, you can measure CPL but not actual customer acquisition cost.
- Total leads by channel — Google Ads, Meta Ads, LinkedIn, organic, email
- CPL by channel, compared against targets and monthly trends
- Lead → MQL rate, percentage of leads becoming marketing-qualified
- MQL → SQL rate, percentage passed to the sales team
- Pipeline generated by channel, potential revenue from open opportunities
- Average lead → first contact time, where high response times usually indicate follow-up issues
This dashboard requires integration between Data Studio and the company CRM (HubSpot, Salesforce or others) through certified connectors or Google Sheets as an intermediate layer.
The logic is the same as the one described in our guide to marketing automation: data should flow automatically, not be copied manually.
Design and readability best practices
A technically correct dashboard that looks visually chaotic will never be used.
These are the design principles that separate dashboards opened every morning from dashboards everyone ignores.
Clear visual hierarchy
The most important KPIs belong in the top-left corner because that is where the eye naturally starts.
Use large scorecards for key metrics and smaller charts for supporting details.
Do not place more than 3–4 elements in the first row.
Always include comparison
A number without comparison means nothing.
Is 1,234 sessions good or bad?
It depends on last week, last month, or the same period last year.
Every key metric must include a delta versus the previous period.
Interactive filters and controls
Add filters for date range, channel, device and campaign.
A dashboard without filters forces users back into Data Studio every time they need a different analysis.
Filters transform a static dashboard into an exploration tool.
One page per audience
Use Data Studio’s multiple-page structure to separate views by audience:
page 1 for management (overview, revenue, trends),
page 2 for marketing (channels, campaigns, content),
page 3 for paid specialists (campaigns, ad sets, creatives).
Each person opens the page they actually need.
Consistent and functional color palette
Use green for above-target results, red for underperforming metrics and grey for neutral states.
Never use colors as decoration: every color should communicate meaning.
A red scorecard immediately signals “pay attention here” without anyone even reading the value.
Common marketing dashboard mistakes
Too many charts, no answers
A dashboard with 20 charts and 40 metrics is not comprehensive — it is useless.
Every additional chart reduces attention on what actually matters.
If you cannot explain in one sentence why a chart exists, remove it.
Misaligned data sources
Combining GA4 sessions with Google Ads clicks without understanding the difference leads to incorrect comparisons.
Sessions and clicks are not the same thing.
No time comparison
A dashboard without comparison to previous periods makes it impossible to understand whether performance is improving or declining.
Dashboard not shared
A dashboard that only exists on the creator’s computer is not a business tool — it is a personal file.
Dashboard never updated
If goals and KPIs change, the dashboard must change as well.
An outdated dashboard leads to bad decisions.
Not an analyst? What to check in your dashboard
If you work with a team or an agency managing your Data Studio dashboards, these are the questions you should ask to understand whether the work is being done properly.
The right questions every month
- Does the dashboard answer specific business questions or only display generic metrics?
- Does every metric include comparison against a previous period or target?
- Are the data sources updated automatically or do they require manual updates?
- Are there interactive filters for channel, device and campaign analysis?
- Is the dashboard shared with every stakeholder who needs access to it?
Warning signs something is wrong
- No one opens the dashboard — it is too complex or does not answer real questions
- Data is still manually copied into Excel — automation is not working
- No historical comparisons — impossible to understand performance evolution
- The dashboard shows everything except the information needed for decision-making
A well-designed Data Studio dashboard is the convergence point of all marketing data:
SEO, advertising, ecommerce and lead generation.
It is the tool that transforms data into decisions, and decisions into measurable results.
If you want to understand how HT&T builds reporting systems for clients, the best starting point is our web analytics and data strategy service.
Dashboard and marketing data: why work with HT&T Consulting
HT&T Consulting is certified by Google Marketing Platform and listed inside Google’s official partner portal.
This recognition strengthens our expertise in measurement systems, reporting, dashboarding and data strategy for ecommerce and B2B companies.
Do you want Data Studio dashboards that support decision-making?
HT&T Consulting designs and implements Data Studio reporting systems for ecommerce brands, B2B companies and agencies — connecting GA4, Google Ads, Meta Ads, Search Console and CRM platforms into real-time dashboards.
Frequently asked questions about Data Studio
What is Data Studio and what is it used for?
Data Studio (formerly Looker Studio and before that Google Data Studio) is Google’s free platform for creating marketing dashboards and reports connected to GA4, Google Ads, Search Console and more than 800 other data sources.
It transforms raw data into automatically updated visualizations that can be shared with teams without manual exports.
Why did Google rename Looker Studio back to Data Studio?
On April 10, 2026 Google announced the return to the Data Studio name in order to clearly separate two products designed for different audiences:
Data Studio for self-service reporting and Looker for enterprise Business Intelligence.
Existing reports migrate automatically without data loss.
Is Data Studio free?
Yes.
Data Studio is free when using native Google connectors such as GA4, Google Ads, Search Console, Google Sheets and BigQuery.
Third-party connectors for Meta Ads, LinkedIn, HubSpot and other platforms usually require additional licenses.
Data Studio Pro adds enterprise features such as governance, advanced permissions and deeper BigQuery integration.
What is the difference between Data Studio and Google Analytics?
GA4 collects and analyzes website data.
Data Studio visualizes that data inside customizable and shareable dashboards.
The two tools are complementary:
GA4 is the data source, while Data Studio is the reporting interface.
How many data sources can be connected to Data Studio?
Data Studio supports more than 800 connectors.
Native Google connectors cover GA4, Ads, Search Console, Sheets, BigQuery and YouTube.
Third-party connectors support platforms such as Meta Ads, LinkedIn, TikTok, HubSpot, Salesforce, Shopify and Stripe.
How do you share Data Studio dashboards?
Dashboards can be shared through links with view/edit permissions, by email to users or Google Groups, or embedded into websites and Google Slides presentations.
Automated PDF email delivery can also be scheduled.
Does Data Studio work with Shopify and WooCommerce?
Yes.
The most common setup is connecting GA4 ecommerce tracking to Data Studio using the native connector.
For deeper order, customer and product data, certified Shopify and WooCommerce connectors are available, or Google Sheets can be used as an intermediate layer.
What is the difference between Data Studio, Power BI and Tableau?
Data Studio is free, optimized for the Google ecosystem and ideal for marketing teams.
Power BI and Tableau provide more advanced analytics and data modeling features, but require expensive licenses and higher technical expertise.
For most marketing teams, Data Studio is more than sufficient.
Checklist: before publishing a Data Studio dashboard
Review these points before sharing a dashboard with your team:
- Every metric includes comparison against a previous period or a visual target
- The most important KPIs are positioned in the top-left area and clearly visible
- Interactive filters exist for dates, channels and campaigns
- Data sources update automatically — no manual refresh required
- The dashboard includes separate pages for different audiences: management, marketing and paid teams
- Colors communicate meaning — green above target, red below target
- No more than 5–6 primary metrics are displayed per page
- The dashboard is shared with every stakeholder using the correct permissions
- Filters have been tested across all devices
- A note or legend explains non-obvious metrics
- GA4 data has been verified against ecommerce or CRM data
- A quarterly KPI and target review process has been planned
A well-designed Data Studio dashboard is never a finished project:
it is a system that evolves alongside business objectives.
Data changes, priorities change, channels change.
The dashboard must evolve with them.
Bibliography and sources
Google Cloud — Data Studio connectors
Official documentation covering available Data Studio connectors, including Google sources, databases, files, cloud storage and marketing platforms.
Google Cloud — Connectors, data sources and credentials
Official guide explaining how connectors, data sources and credentials work inside Data Studio reports.
Google Developers — Community Connectors
Technical documentation about Community Connectors used to connect Data Studio with external online data sources.
Google Cloud Blog — Looker and Looker Studio
Google’s deep dive into the integration between Looker and Looker Studio and the distinction between self-service reporting and governed Business Intelligence.
HubSpot — State of Marketing Report
Annual report on marketing team priorities, including AI, automation, productivity, trust and growth trends.
Continua a leggere
8 minutes of reading

19 minutes of reading


And it consumes less energy.
To return to the page you were visiting, simply click or scroll.