Data Visualization. Simplify data, accelerate decisions.

In today’s digital economy, where over 2.5 quintillion bytes of data are generated every day, the ability to transform complex numbers into clear, actionable insights is no longer an option, but a strategic necessity. This flood of information, however, presents a paradox: companies have more data than ever, but struggle to extract concrete meaning from it. Raw data, on its own, is silent. To transform it into strategic intelligence, a language is needed that can translate its complexity into a coherent narrative. This language is Data Visualization.
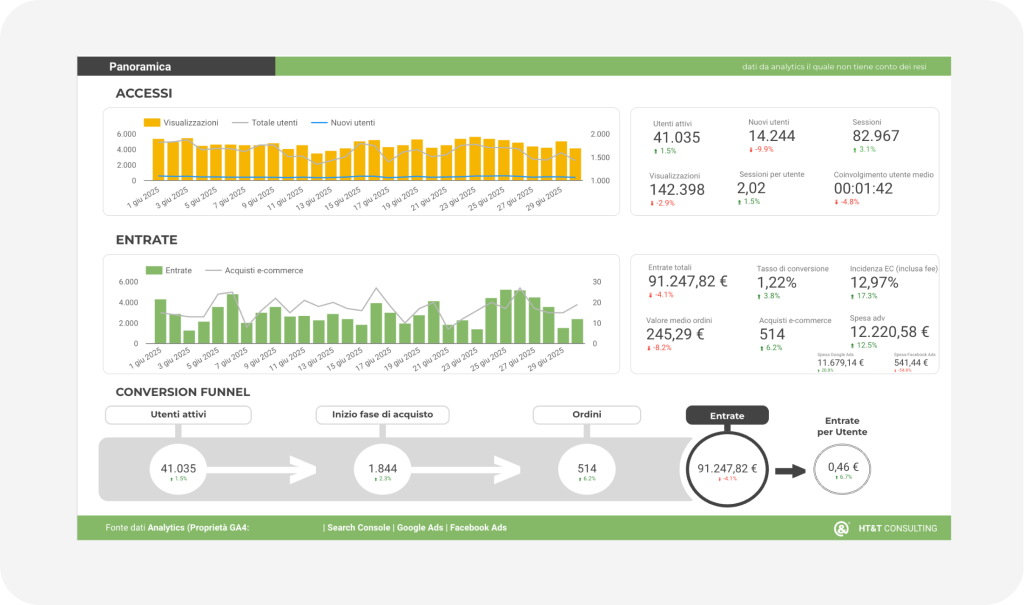
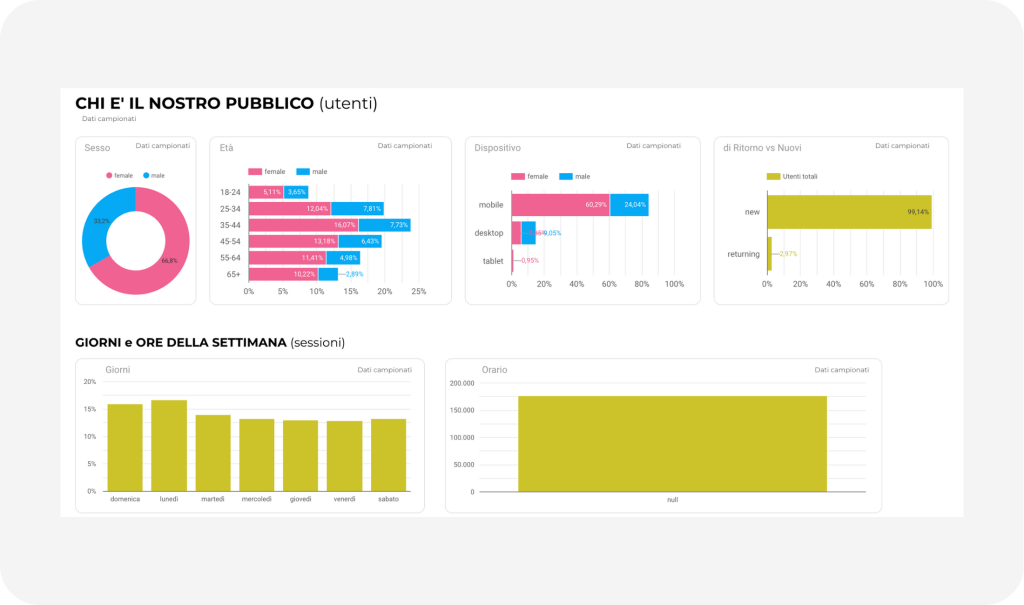
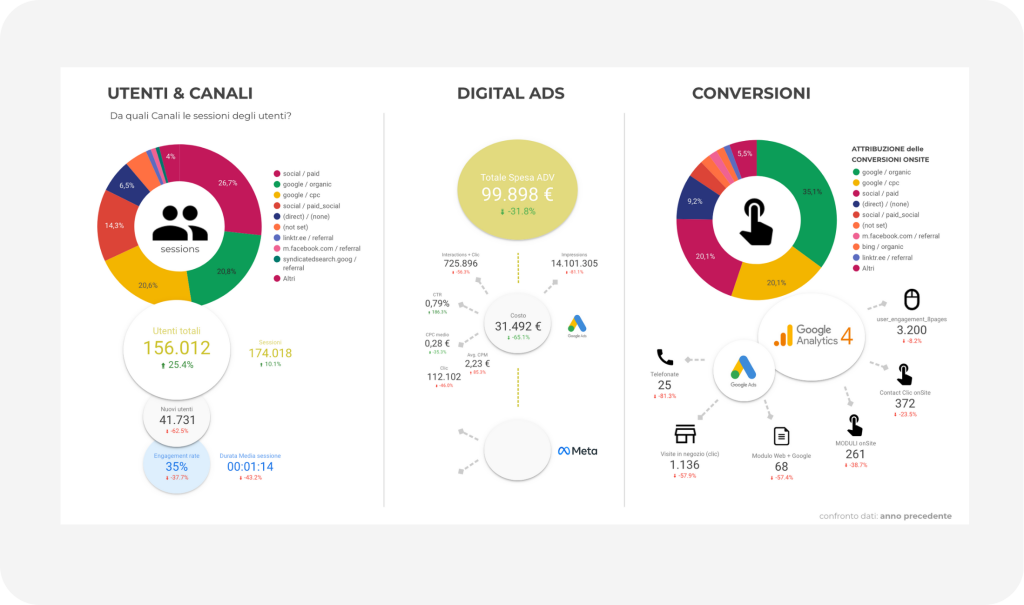
Data visualization is not simply a matter of aesthetics, but a true strategic discipline, an indispensable bridge between possessing data and understanding it deeply in order to act with informed awareness. At HT&T Consulting, this is not just a belief, but the foundation of our operating method. Our approach is rooted in a deep specialization in tracking, data, and KPIs. For us, data is not a secondary aspect, but the raw material upon which every successful strategy is built. We use it in every project, developing customized Data Visualization solutions for many of our clients that make the consumption of data and results faster, clearer, and, above all, useful.
Beyond the pie chart: what really is Data Visualization?
Data Visualization is the process that uses visual elements such as charts, graphs, or maps to represent complex data in a form more easily processed by the human brain. It is a discipline that combines creative practice and technical expertise, with the goal of making data accessible not only to specialists, but to a wider business audience.

The 3 pillars of effective visualization: narrative, data, visualization.
To go beyond a mere superficial understanding of Data Visualization means recognizing that it’s not about “showing data,” but about “building a narrative.”
An effective visualization is founded on 3 essential components:
- Narrative: This is the objective that guides the analysis. It represents the business question you are trying to answer. It could be the analysis of conversions on an e-commerce site, the evaluation of the Click-Through Rate (CTR) of a new advertising campaign, or the identification of pages with the highest user drop-off rate. The “narrative” is the strategic “why” that precedes every technical choice.
- Data: This is the raw material. This phase doesn’t just consist of gathering data from Google Analytics or Ad platforms, but involves the critical work of identifying, cleaning (removing duplicates or inconsistencies), eliminating anomalies (outliers), and preparing it for analysis. The quality of the data is the prerequisite for any valid insight.
- Visualization: This is the final representation, the choice of the most suitable graphic elements to communicate the results. It includes selecting the type of chart, the strategic use of colors and titles to communicate, for example, which marketing channels generated the most qualified traffic or how conversions varied over the course of the campaign. A chart without a clear question is just decoration; a chart that answers a critical question is a decision-making tool.
A historical example of narrative power.
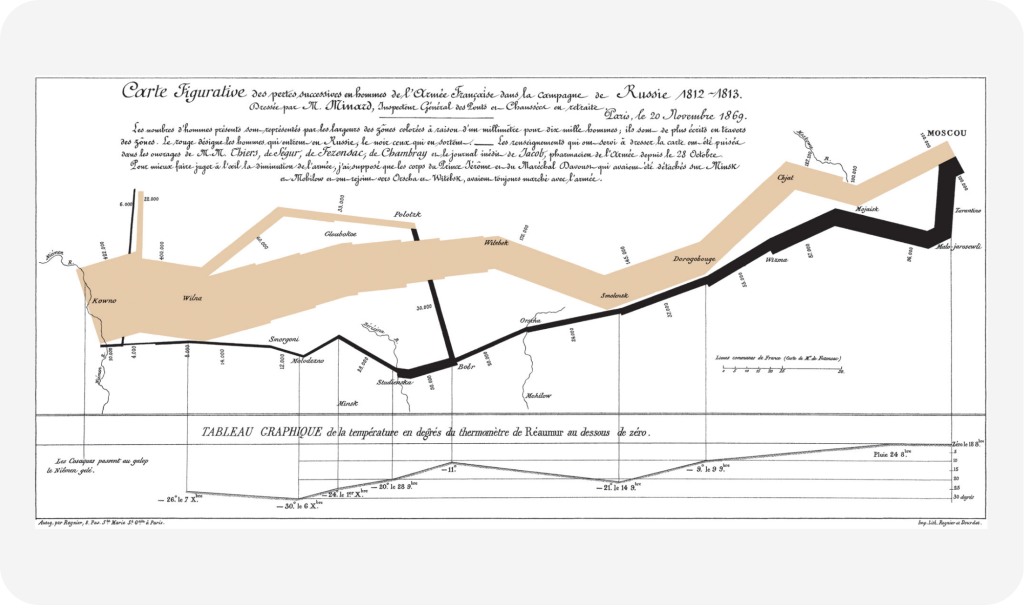
To understand the narrative power of visualization, one only needs to look to the past. Charles Minard’s famous 1869 map, which depicts Napoleon’s disastrous Russian campaign, is considered one of the best data visualizations of all time. In a single image, Minard tells a complex story, showing the army’s decline, its position, the direction of the march, and the freezing temperatures during the retreat. This representation doesn’t just present numbers; it immediately demonstrates the cause-and-effect relationship between the cold and the decimation of the troops, making a historical event tangible and understandable.

Why Data Visualization is So Effective
The effectiveness of Data Visualization is rooted in the biology and psychology of our brain. To ignore this fact is to choose a less efficient and persuasive method of communication.
Our brain is optimized for visual processing. Neuroscientific research has shown that data visualization is effective because it shifts the balance from cognition (thinking, which is slow and strenuous) to perception (visual, which is incredibly fast and efficient).
Some data quantifies this advantage:
- The human brain processes images approximately 60,000 times faster than text.
- About 90% of the information transmitted to the brain is visual.
- We can process the meaning of an image in just 13 milliseconds.
This biological predisposition means that presenting data in a visual format is equivalent to communicating with the brain in its native language.
Furthermore, a well-designed visualization reduces “cognitive load,” which is the mental effort required to process information. Reading a table of numbers requires sequential and laborious analysis. A chart, on the other hand, leverages “preattentive attributes“, visual properties like color, shape, and size that our brain processes in milliseconds, before conscious thought. A red dot in a sea of gray dots is noticed instantly, freeing up mental resources for analysis and decision-making.
The Immediate Identification of Patterns, Trends, and Correlations
One of the most powerful benefits of Data Visualization is its ability to reveal patterns, trends, and correlations that would remain hidden in a spreadsheet. A line chart can highlight a seasonal fluctuation, a scatter plot can show a correlation between spending and conversions, and a heat map can identify the most profitable customer clusters. This is where Data Visualization becomes a compass to guide future strategies.
This efficiency translates into credibility. A study by Cornell University found that when presented with a scientific claim, 68% of people found it credible. By adding a simple graph, the percentage rose to 97%. A visualization doesn’t just present the facts: it creates a sense of certainty and trust.

From Data to Action: The Role of Data Visualization in Business Decision-Making
The advantages of Data Visualization translate into tangible benefits for the business, transforming how companies operate and make decisions.
Concrete benefits include:
Faster and more informed decisions: By simplifying complexity, visualization accelerates the decision-making process.
Greater transparency and collaboration: Shared dashboards and reports ensure that all teams are working from the same evidence. This “democratizes” analysis, breaks down information silos, and strengthens collaboration.
Increased productivity: Visualizations optimize executives’ time, allowing them to grasp key facts more quickly and then focus on strategic decisions.
Promotion of a data-driven culture: When insights are clear and accessible, organizations are more likely to base decisions on evidence rather than intuition. This leads to more robust choices and better results.
Data Visualization at HT&T Consulting
At HT&T Consulting, our approach to Data Visualization is based on the direct application of these principles. Our deep focus on tracking, data, and KPIs is not a technical whim, but the pillar of our strategic consulting. The value lies not in the tool itself, but in the strategy that defines what to measure and why.
Our process is rigorous and results-oriented:
Audit and Goal Definition: We analyze the client’s data ecosystem and collaboratively define the most relevant KPIs, directly linked to business objectives.
Data Architecture and Preparation: We design the tracking infrastructure to collect accurate and reliable data. Using tools like Supermetrics, we create automated pipelines that aggregate information from dozens of sources (Google Analytics, CRM, Ad platforms, etc.), unifying them for a holistic view.
Visualization Design and Development: We design and create custom solutions, typically interactive dashboards on platforms like Looker Studio, Tableau, or Power BI. We transform complex data streams into a single, clear, and intuitive control panel.
Training, Adoption, and Optimization: We train the client’s teams, support the adoption of the tools, and monitor performance for continuous improvement.
Our goal is not to provide a simple dashboard, but to build the analytical engine that powers the strategic decisions and growth of our clients.
Discover more about HT&T Consulting’s Data Viz Service.

The Ethics of Clarity: Principles for “Responsible” Data Visualization
The power of Data Visualization to persuade carries with it a great responsibility. A visualization can illuminate the truth, but it can also distort it. Ethical visualization pursues honesty, accuracy, and clarity, with the goal of informing correctly, not deceiving.
To build responsible visualizations, it is necessary to adhere to a set of guiding principles.
The foundation is honesty and accuracy, which requires presenting data truthfully, using complete and transparent sources. Closely linked to this is the principle of clarity and simplicity, always prioritizing readability and removing any superfluous elements that could create confusion. Furthermore, it is essential to pursue fairness and objectivity, striving to present data impartially and providing the necessary context for correct interpretation. Another non-negotiable pillar, especially when working with sensitive data, is respect for privacy, which is achieved through anonymization or aggregation techniques to protect individuals’ identities. Finally, the concept of accessibility requires designing visualizations that can be understood by everyone, including people with disabilities, by using adequate contrast and alternative text.
Data Visualization as the Language of the Future
Data Visualization is increasingly representing not just a technique, but a fundamental strategic skill, essential for competitiveness.
At HT&T Consulting, we have internalized this language to the point where it has become the core of our method. We act as strategic partners who orchestrate the entire process: from defining KPIs, to the ethical collection of data, to the creation of visualization systems that transform complexity into a clear, measurable, and actionable competitive advantage.
Your data has a story to tell. A story of opportunities, challenges, and growth.
At HT&T Consulting, we help you translate it into strategic decisions.
Continua a leggere
And it consumes less energy.
To return to the page you were visiting, simply click or scroll.


